

NM-GREET Models Released for Public Comment – Review and Comparison to CA-GREET 4.0
Background
The New Mexico Environment Department Clean Transportation Fuel Program (NMED CTFP), established when House Bill 41 was signed into law in 2024, began credit and deficit generation on April 1, 2026. The program aims to decrease greenhouse gas emissions in New Mexico by 30% by 2040.
Like its West Coast predecessors, the NMED CTFP utilizes a customized version of the United States Department of Energy Greenhouse Gases, Regulated Emissions, and Energy use in Technologies (GREET) model as the basis for its carbon intensity calculations. These models are developed and updated by Argonne National Labs and are called the R&D GREET models. New Mexico specific models, which include simplified calculators for specific pathways (Tier 1) and a general model with all data (Tier 2), were released for public comment in early July 2026. The Tier 2 model is also called the NM-GREET v1 model.
Comparison to Current CA-GREET4.0 Models
The NMED CTFP Tier 2 model utilizes R&D GREET1 2023 as the base model and then adjusts settings according to the goals of the CTFP regulation, as outlined in the included Parameters_NM tab of the workbook. The corresponding Tier 2 model from the CARB LCFS, CA-GREET4.0, uses the R&D GREET1 2022 model as the base model.
The NMED CTFP simplified Tier 1 calculators use the same architecture as the current CARB Tier 1 calculators with a modified emission factor set that reflect assumptions specific to the NMED CTFP.
Allocation
Allocation is the process by which the emissions in a lifecycle analysis are distributed to the products and co-products of a process and can be determined based on inherent physical properties such as mass or energy or based on the economic value of the streams.
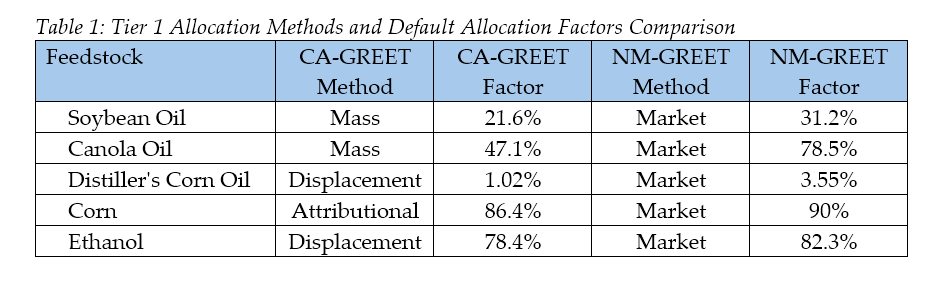
For Hydroprocessed Esters and Fatty Acids (HEFA) pathways, NM-GREET retains energy allocation for the distribution of emissions from the fuel production process to products and co-products, matching CA-GREET. The NMED has chosen economic allocation for the cultivation and production of soybean and canola oil. Comparatively California, Oregon, and Washington use mass allocation for all vegetable oils. The market value data used as the basis for the economic allocation factor are explicitly listed in Section 3.1 of the BioOil tab in the Tier 2 calculator. A comparison between allocation methods and allocation factors for HEFA fuel and feedstocks that differ between the two models is shown below in Table 1.
For starch EtOH pathways, the NM-GREET model contains several updates to factors relating to corn or sorghum ethanol production. For ethanol pathways, NM-GREET uses economic allocation for both feedstock and fuel production allocation methodology. CA-GREET calculates coproduct displacement. Due to the low corn oil yield for dry mill ethanol, this change has a relatively small impact on the carbon intensity (CI) scores for ethanol despite making a large impact on the CI for corn oil based HEFA. A comparison between allocation methods and allocation factors for corn and EtOH is shown below in Table 1.
Feedstock Emission Factors
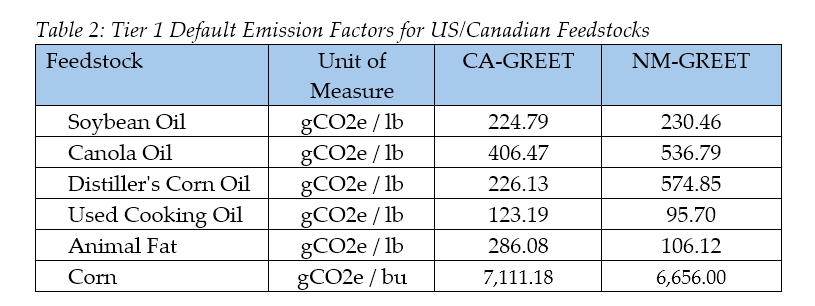
NMED transparently documents how their default feedstock emission factors were calculated. Distiller’s corn oil has the largest cultivation emissions factor increase between NM-GREET and CA-GREET. This is primarily driven by the change to economic allocation for ethanol co-products compared to CA-GREET. Due to the low corn oil yield for dry mill ethanol, this change has a relatively small impact on the CI of ethanol plants, but a very large impact on the CI of HEFA derived from corn oil.
The NM-GREET soybean oil emissions factor has a lower increase than expected from the change from mass allocation to market allocation. This is because the NM-GREET tier 1 default emission factor only includes the soybean farming emissions and not oil extraction. Similarly, the NM-GREET Tier 1 default emission factor for canola oil is based on the farming and transport emissions alone, and do not consider emissions from oil extraction.
Used cooking oil feedstock emissions decrease under the NM-GREET because of changes in the underlying R&D GREET model, decreasing the energy requirements of rendering from 1,073 Btu/lb UCO to 1,015 Btu/lb UCO. Animal fat also sees a large decrease for NM-GREET for similar reasons. The rendering energy in NM-GREET v1.0 has decreased to 1,566 Btu/lb tallow, compared to 3,944 Btu/lb tallow in CA-GREET4.0. Both the UCO and animal fat also include the energy allocation factor for HEFA production in the default factors.
For EtOH pathways, NM-GREET utilizes different emission factors for corn cultivation due to changes in the selected underlying R&D GREET model. The differences in corn cultivation emissions yields a decrease in CI scores when compared to CA-GREET4.0.
Feedstock emission factors are summarized in Table 2.
Other Emission Factors
In addition to the feedstock emission factors, the feedstock and HEFA transportation emission factors differ between CA-GREET and NM-GREET. In general, the emission factor differences between CA-GREET and NM-GREET are caused by updates to the underlying R&D GREET model defaults.
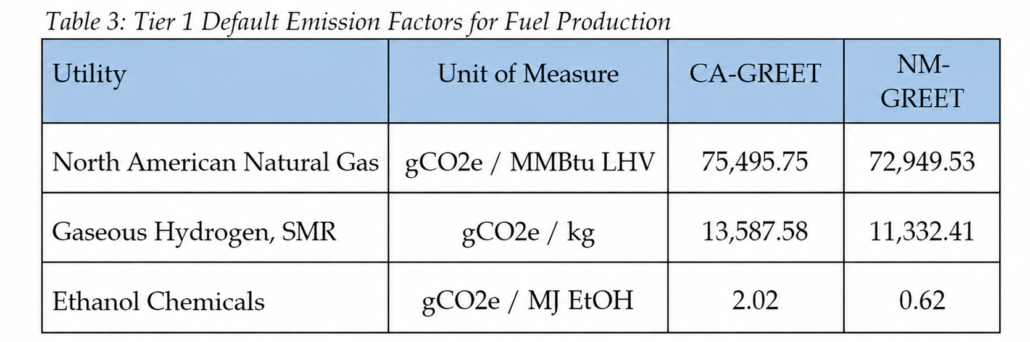
Following CARB’s lead, NMED has opted to modify the base petroleum production emission factors based on the OPGEE 2.0 model, which leads to differences in the overall carbon intensity of fossil energy sources. North American natural gas sees a decrease to 72,950 gCO2e/MMBtu LHV in NM-GREET, down from 75,496 gCO2e/MMBtu LHV in CA-GREET.
The hydrogen emission factor for gaseous hydrogen produced via steam-methane reformation of North American natural gas is considerably lower for NM-GREET due to the exclusion of pipeline transportation emissions, which CA-GREET includes.
Changes in the ethanol chemical CI contribution are due solely to changes in the underlying R&D GREET model. A comparison of these fuel production emission factors can be found below in Table 3.
The CA-GREET and NM-GREET Tier 2 models both utilize the default electrical grid emissions factors and regions from their respective R&D GREET basis models. CA-GREET uses R&D GREET 2022 as the basis, which incorporates electrical grid factors from eGRID 2021. NM-GREET uses R&D GREET 2023 as the basis, which incorporates electrical grid factors from eGRID 2022. With the exception of the HIMS and HIOA grid regions for the state of Hawaii, which see a small increase in grid factor, all other grids see a decrease in emission factor.
Summary
While the exact CIs calculated using the released for public comment version of NM-GREET model and current CA-GREET4.0 model will depend on site-specific inputs, similar trends should appear in most HEFA plants. Production emissions will be slightly lower in NM-GREET, and transport and end use of fuels will be 2.5 points lower due to changes in the selected transport emissions factors in each program, but these changes will be overshadowed by the differences in how the two programs handle feedstock allocation. Under NMED CTFP, the CI for HEFA derived from soybean oil is around 5% lower than CARB LCFS, while canola oil is around 5% higher. HEFA derived from animal fat or used cooking oil will see 40% and 20% decreases, respectively between programs. Finally, HEFA derived from corn oil will see almost a 50% increase in CI under the CTFP.
If you are looking for more detailed information or help navigating the NM-GREET model, please contact our low carbon fuels team lead, Hannah Losey P.E. at Hannah.Losey@tricordconsulting.com.

